
Cyclistic Bike-Share Case Study
Project Information
- Project: How does a bike-share navigate speedy success?
- Category: Data Analytics Case Study
- Tools: R, tidyverse, lubridate, ggplot2, Excel
- Data Period: 2019 – 2020
- Repository: GitHub
How do annual members and casual riders use Cyclistic bikes differently?
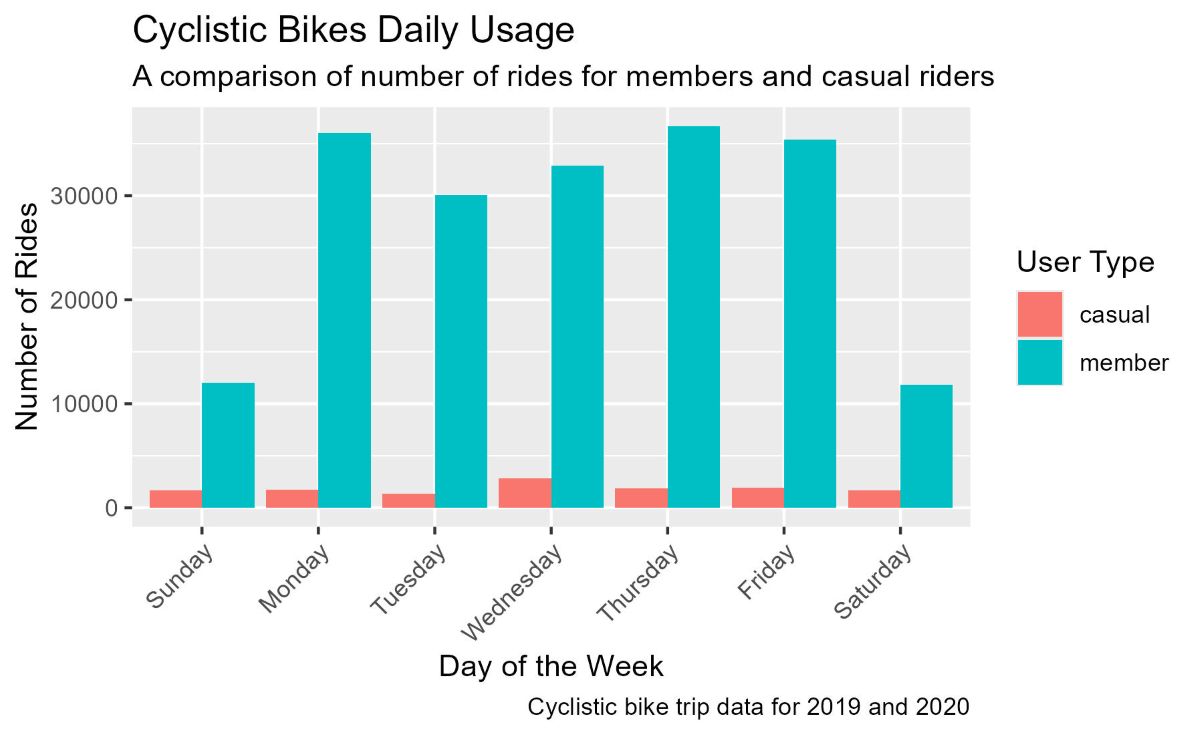
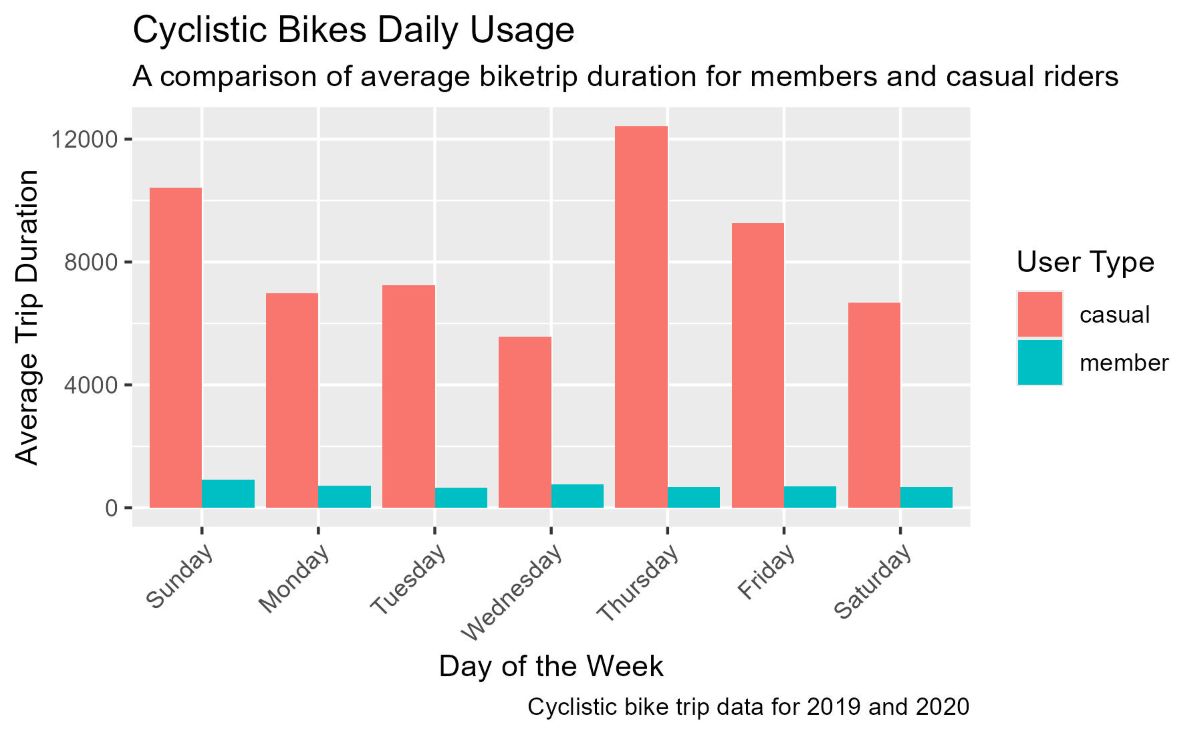
This case study analyzes Cyclistic’s historical bike-share data to understand how annual members and casual riders use bikes differently. Using R for data cleaning, transformation, and visualization, I found that annual members exhibit consistent weekday usage indicative of commuting, while casual riders take longer trips aligned with leisure behavior.
Despite annual members being more profitable, they represent only about 30% of users. Based on the insights, I recommended duration-based pricing for casual riders, weekend-focused incentives within memberships, and exclusive medium- and long-term member plans to improve conversion and revenue growth.